
Years ago I read Douglas Hubbard’s The Failure of Risk Management, and one question in it has never quite let go of me. Hubbard is a quantification man, one of the people who taught the field to measure, and he opened by asking the thing almost nobody asks: what is the risk of risk management itself? If a risk method can be wrong, if it can even add error of its own, how would you ever know? A broken risk process, he wrote, is the ultimate common-mode failure, the one risk sitting above all the others, quietly deciding whether any of them are being handled or merely described [1].
I have watched this field for several years, and I don’t think that meta question has been answered. Not by the heat maps it was aimed at, and not by the quantified methods since offered as the cure. That unanswered question is the whole reason I’m not all in on Cyber Risk Quantification (CRQ). Not because I think it’s worthless, but because it keeps being sold as the answer to a question it hasn’t actually closed. And I should admit, before I go further, that I do not have the answer either. I can see the problems clearly; I do not have a solution. What follows is a diagnosis, not a cure.
You can watch the field decline to answer it right now, as per arguments being made. One camp says stop trying to quantify at all, because after years of dashboards and dollar figures few analysts can point to a decision their numbers changed [2]. The other says the tool isn’t broken, we’re just using it badly: drop the point estimates, use ranges, run the Monte Carlo, tie the output to the risk tolerance the business already carries in its insurance limits [3]. Both are right about something. But notice they are arguing about the numbers, whether the inputs are good enough, whether the outputs are precise or false. Neither is asking Hubbard’s question: whether the model those numbers feed is the right shape for the thing it models. That is where the answer actually lives, and it is the one place nobody is looking.
CRQ heart is in the right place
Start with what CRQ gets right, because it gets a lot right. The thing it replaced, the red/yellow/green heat map, genuinely fails1. “High” cannot be weighed against a budget. Arguments never settle; they slide from the substance of the risk to whether it belongs in the amber cell or the red one. And the arithmetic underneath is a fiction: you cannot add or multiply ordinal labels and get anything meaningful out. Anyone who has sat through the meeting where “red” earns a slow nod and no decision knows that failure in their bones. CRQ’s founding instinct is exactly right: put risk in the same unit the business already makes every other trade-off in, dollars.
There is an obvious objection to quantifying cyber risk, and it is worth stating plainly: there is not enough data. Cyber events are one-offs against adversaries who adapt, and you cannot ground a probability without repeated trials. That is the first place my own instincts go, because I lean frequentist2, and the objection is really that leaning talking.
But “not enough data” is itself a statistical claim, and one almost nobody stops to justify: enough for what, and by what standard? The frequentist answer is repeated trials, yet that only assumes what should count as data. The CRQ camp’s reply is that there is enough, because the input was never meant to be trial data in the first place. CRQ, done well, does not fit frequencies; it quantifies calibrated belief3, a considered estimate expressed as a range and updated as evidence arrives, and the honest practitioner is upfront that the number is a state of belief, not a measurement4. That is where Bayesian reasoning and calibrated experts come in. Whether it satisfies you depends on whether you accept the move. I do, enough to set the objection aside. Grant CRQ its inputs. My problem is not there.
My problem is the shape
A model is useful5 when its shape matches the thing it represents. Here is how cyber risk actually behaves, and how neither the heat map nor its quantified successor represents it.
Risks are not independent across time. Every incident that lands consumes something finite: budget, the attention of a response team that does not scale, operational reserves, management bandwidth. The organization that meets the second event is not the one in the risk register; it is a weaker one, its slack already spent on the first. A $50K incident in January and a $1M incident in March are not independent draws even when their causes are entirely unrelated, because January degrades the conditions March arrives into. But annualized loss expectancy, whether it comes from a heat map or a Monte Carlo simulation, assumes a fresh, unchanged starting state for every event. It models a steady world. Cyber risk does not live in one.
And risks are not independent of each other. Two threats that share no causal mechanism still compete for the same fixed budget, the same people, the same decision-making bandwidth, so they move together anyway. Deplete the pool responding to one, and you have raised the effective impact of whatever arrives next. This is correlation that emerges from shared organizational state, not from any property of the threats, which is exactly why no method catches it: risk registers are flat lists, FAIR analyses are built one scenario at a time6, and a loss-exceedance curve sums its components assuming they are independent, because nobody can specify correlations that exist only dynamically, in the moment, as a function of what already happened.
Now look at what the heat map does with all of this: nothing. Every cell assumes a baseline state; eight amber risks sit in their boxes looking independent. CRQ does the same nothing, but through machinery that makes it look like rigor. Its central move is to sum the individual risks into a portfolio and run the Monte Carlo over them to produce the loss-exceedance curve the board actually sees, and that sum assumes exactly the independence the coupling denies. So each component can be perfectly reasonable and the portfolio total can still describe no world the organization will ever occupy: validated parts, invalid whole, and the invalid whole is the number the simulation hands you. It is the same blind spot as the heat map, now in a better suit.
Confidently wrong, and no way to tell
This is why “do it better” doesn’t reach the problem, and why “stop quantifying” is right for the wrong reason. Better ranges and more simulation refine the numbers inside a model whose shape is already wrong. And a wrong shape rendered in crisp probability is worse than a wrong shape rendered in color, because the heat map fails openly: everyone knows the colors are a show of judgment, while the histogram fails behind the credentials of actuarial science. It buys confidence the analysis has not earned. The gap between how sure the output looks and how much the model actually warrants is wider with CRQ than it ever was with the matrix, and that gap is where the danger lives.
And here is where Hubbard’s question comes back with no answer, because the model never grades itself. A year passes, nothing happens, and the estimates get updated, but from fresh external data: new threat reports, re-elicited expert ranges. Not from any reckoning with what last year’s forecast said would happen. A quiet year is almost no signal about a rare event, and the process shifts faster than signal could accumulate, so the loop that would tell you whether the method works stays open. The system runs open-loop, re-primed from the outside and never corrected against its own record. The risk of risk management is precisely the thing the method is built never to see.
That open loop is only half of it. Even from the outside there is no way to check the method, because there is no experiment to run: you cannot put the same organization through the same year twice, once trusting the number and once ignoring it, and compare. There is no control group and no counterfactual, and a single year, breach or none, cannot falsify a claim like a 10% chance of exceeding $15M. So “useful” never gets tested, and the method survives on how convincing it sounds. Set that beside the correlated portfolio, and Hubbard’s question answers itself: the one number the method produces has already been invalidated by the coupling, and there is neither a loop nor an experiment that could ever reveal it. The risk of the method is unknowable by construction, its one output beyond trust and beyond checking.
What I’d keep, and what I wouldn’t
None of this makes quantification worthless, and I’m not in the “stop trying to manage risk” camp. The demand that started CRQ is real: decisions need a common currency, and dollars are the right one. Over the ordinary, survivable middle, the recurring losses an organization absorbs and lives to measure again, a loss curve is genuinely the best tool on offer, and the discipline of forcing private worry into an explicit, shared estimate earns its keep on its own. (The other end, where a single correlated event runs past what the organization can survive, breaks the model in a different and sharper way, but that is a story for another day.)
What I’m not all in on is the belief that better numbers fix a wrongly shaped model, or that a confident curve is the same as a validated one. Taking Hubbard’s question seriously doesn’t mean abandoning quantification; it means holding it to its shape. Quantify the survivable middle and act on it; treat the coupled, catastrophic tail by other means, whether capacity, reserves, or resilience, rather than pretending the curve can see it.
Risk analysis is not the decision
Step back far enough and the deepest mistake is not in the model at all. Hubbard draws risk work as three nested boxes: risk analysis sits inside risk management, which sits inside the real business of deciding what to do. CRQ lives in the innermost box. It produces a loss curve, and a loss curve is not a decision. It is not even risk management; it is the analysis that feeds it.
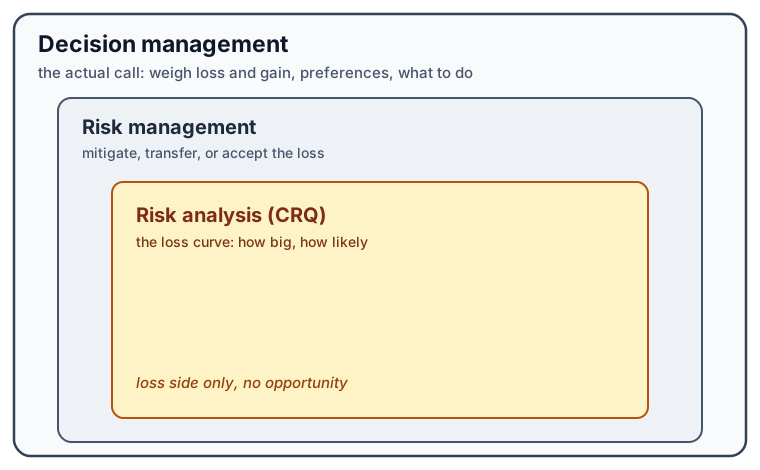
The curve is also only half of what a decision needs. It measures uncertainty about loss and never uncertainty about gain, the opportunity side of the same choice, which is why risk work done on its own, in Hubbard’s words, “makes as much sense as a left-foot shoe department.” And the outer box is not a vague gesture at “the decision.” Decision analysis is its own established discipline, older and wider than risk quantification7, and CRQ is one narrow, one-sided input to it.
It would not matter much if we kept the boxes straight. The trouble is that the field keeps promoting the inner box into the outer one: the histogram arrives, and producing it gets treated as though it were the decision. That is why a sharper curve feels like sharper judgment when it changes none of the judgment, and it is why the shape problem matters at all. A confidently wrong curve, mistaken for the decision, is a bad decision wearing a good chart.
So this is where I land. Hubbard asked what the risk of risk management is. Part of the answer is that risk management was never the decision, and CRQ is not even risk management. It is one bounded, one-sided input to a choice that is larger and older than it. The honest use of it is to keep it in its box, and never to mistake the loss curve in front of you for the decision it can only inform.
I said at the start that I don’t have the answer, and I don’t. Neither the colors nor the curve tells me the risk that actually matters, and I have no third method that does. What I have is a direction, and it owes more to Shostack than to me: stop trying to measure the risk better and start making the system better. Harden what you can, shorten how long a hit lasts, lean less on any forecast being right. Resilience pays off whether or not the number was ever accurate. That is not a solution to the risk-analysis problem. It is what I do while the problem stays unsolved.
References
- Douglas W. Hubbard, The Failure of Risk Management: Why It’s Broken and How to Fix It, which asks whether a risk method can itself be the biggest risk you carry (Wiley, 2nd ed. 2020).
- Adam Shostack, “Stop Trying to Manage Risk,” OWASP Global AppSec 2025, the critique that quantification rarely leads to a decision (talk, 2025).
- Steve McMichael, “A GRC Practitioner’s Response”, the “do it better” defense of CRQ (essay, 2025).
- Tony Martin-Vegue, From Heatmaps to Histograms, the practical, Bayesian-calibrated case for CRQ (Apress, 2026).
-
This is settled ground, so I’m pointing to the literature rather than re-arguing it. The formal case is Anthony Cox’s peer-reviewed What’s Wrong with Risk Matrices? (2008), which shows how ordinal categories produce rank reversals (a higher expected-loss risk scored below a lower one), incomparability, and spurious resolution. For the practitioner version, see the FAIR Institute’s 13 Reasons Why Heat Maps Must Die and its companion talk, and David Vose’s reasons to avoid the colored matrix. ↩︎
-
For the backstory, Peter L. Bernstein’s Against the Gods: The Remarkable Story of Risk is the readable history of how we learned to put numbers on uncertainty at all, from the first probabilists through insurance to the frequentist and Bayesian traditions this argument sits between. ↩︎
-
“Calibrated” here is a technical claim, not a synonym for “careful.” An estimator is calibrated when stated confidence matches hit rate: when a calibrated person says they are 90% sure, they turn out right about 90% of the time. Most people are badly overconfident by default, but calibration is both measurable and, the research finds, trainable, with Hubbard’s calibration exercises and Tetlock’s forecasting work as two well-known strands, on a foundation laid by Lichtenstein, Fischhoff and Phillips. That is what lets an elicited range count as more than a guess, and it is the load-bearing move behind CRQ’s claim to quantify belief rather than merely assert it. ↩︎
-
This is the whole project of the current practitioner literature, most fully in Martin-Vegue’s book [4]: the CRQ number is a calibrated degree of belief expressed as a range, not a fitted frequency, and confidence is “something you do, not something you calculate.” Granting that is what lets this piece move past the tired “you don’t have the data” objection to a different one. ↩︎
-
“A model is useful” invokes George Box’s much-quoted “all models are wrong, but some are useful,” which is also much abused, usually as a shield: all models are wrong, so stop criticizing mine. Box meant nearly the opposite. Usefulness for him is purpose-bound and earned, not assumed; you have to find where a model is importantly wrong first, because “it is inappropriate to be concerned about mice when there are tigers abroad.” The question is never whether a model is wrong, since all of them are, but how useful it is for the decision at hand, which is exactly the meta-question this piece is trying to answer. Here, the shape mismatch is the tiger. ↩︎
-
FAIR (Factor Analysis of Information Risk) is the dominant framework for actually doing CRQ. It decomposes a risk into loss event frequency and loss magnitude, breaks those into sub-factors, and feeds the estimates through a Monte Carlo simulation. It is the concrete thing most people mean by quantifying cyber risk, which is why it stands in for CRQ here, and its scenario-by-scenario structure is exactly what leaves the correlations above unmodelled. ↩︎
-
Decision analysis is a mature field in its own right, far older and wider than cyber risk quantification. It draws on utility theory, options theory, operations research, and the documented psychology of how people actually decide, including bias, noise, and loss aversion. CRQ touches almost none of it; it hands one number, the loss side, to a discipline built to weigh a great deal more. ↩︎